
Consider a robot that sends camera frames to a cloud model four times a second. Every 250 ms it needs a new chunk of actions. If the model takes 87 ms to compute a reply, that leaves about 163 ms to get the frames to the GPU and the actions back to the robot. What happens when Wi-Fi drops a packet?
In our case for off-board inference, we argued that network variability is an engineering problem we can make progress on. Packet loss is one place to start. A transport can deliver every reply and still leave the robot hesitating while it waits for the next action. How quickly the transport recovers matters most on the slowest round trips.
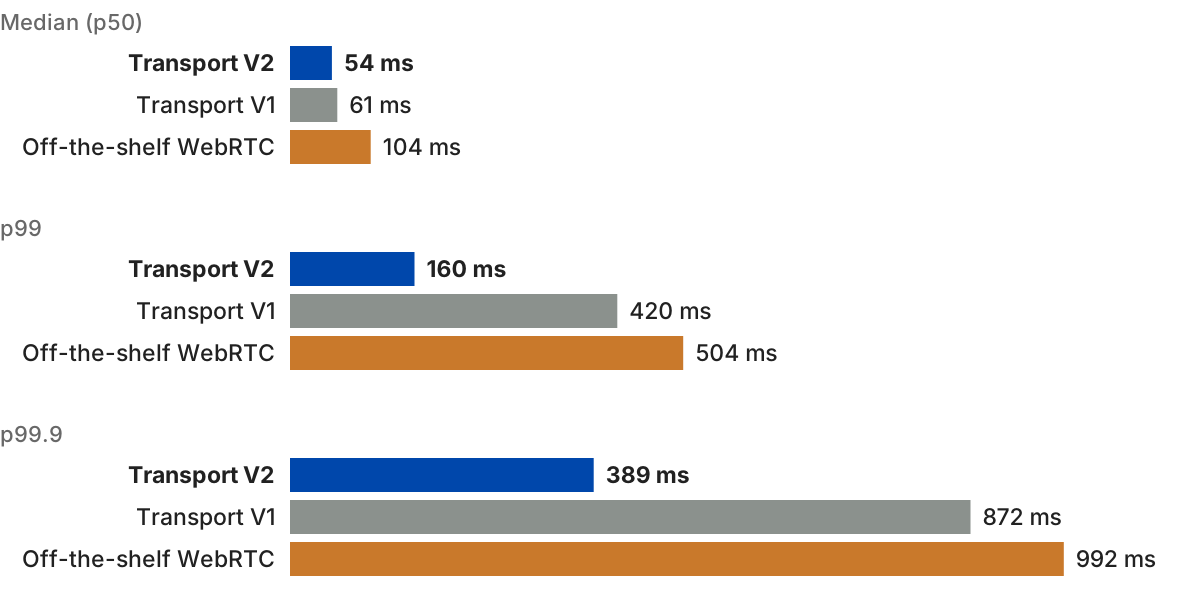
We rebuilt Dreamscale’s robot-to-cloud transport to recover faster from packet loss. In a four-hour test on home Wi-Fi, the median request saved 7 ms of network time. At p99, network time fell from 420 ms to 160 ms, just inside that 163 ms budget. The robot spent 87% less time waiting for actions.
Measuring a 4 Hz control loop
We connected one robot client to a GPU host in US West over home Wi-Fi and cable broadband. Each observation contained three synthetic camera frames sized to match real inputs, about 70 kB in total. The client targeted four observations per second and waited for each reply before sending the next. A stand-in for the model reproduced a compute time of about 87 ms so we could compare transports under the same inference workload.
A home network can change appreciably in an hour. To keep a quiet stretch of Wi-Fi from favoring one transport, we interleaved requests at random offsets. All three transports used the same link during the same four hours.
- Transport V1 was our production transport until this month. It used QUIC with standard congestion control to connect directly to the GPU host.
- Transport V2 uses the same direct QUIC path with faster recovery from packet loss.
- Off-the-shelf WebRTC carried the same observations and replies over the reliable data channel of a managed real-time platform.
How often did the robot have to wait?
We measured latency from two perspectives. For each request, we subtracted model compute time from the round trip to get network time. The median, p99 and p99.9 describe a typical request and the thresholds for the slowest 1% and 0.1% of requests. For the robot, we counted the fraction of 250 ms control steps it spent waiting for a late reply.
| Median | p99 | p99.9 | Time waiting | |
|---|---|---|---|---|
| Transport V2 | 54 ms | 160 ms | 389 ms | 1.0% |
| Transport V1 | 61 ms | 420 ms | 872 ms | 7.7% |
| Off-the-shelf WebRTC | 104 ms | 504 ms | 992 ms | 9.0% |
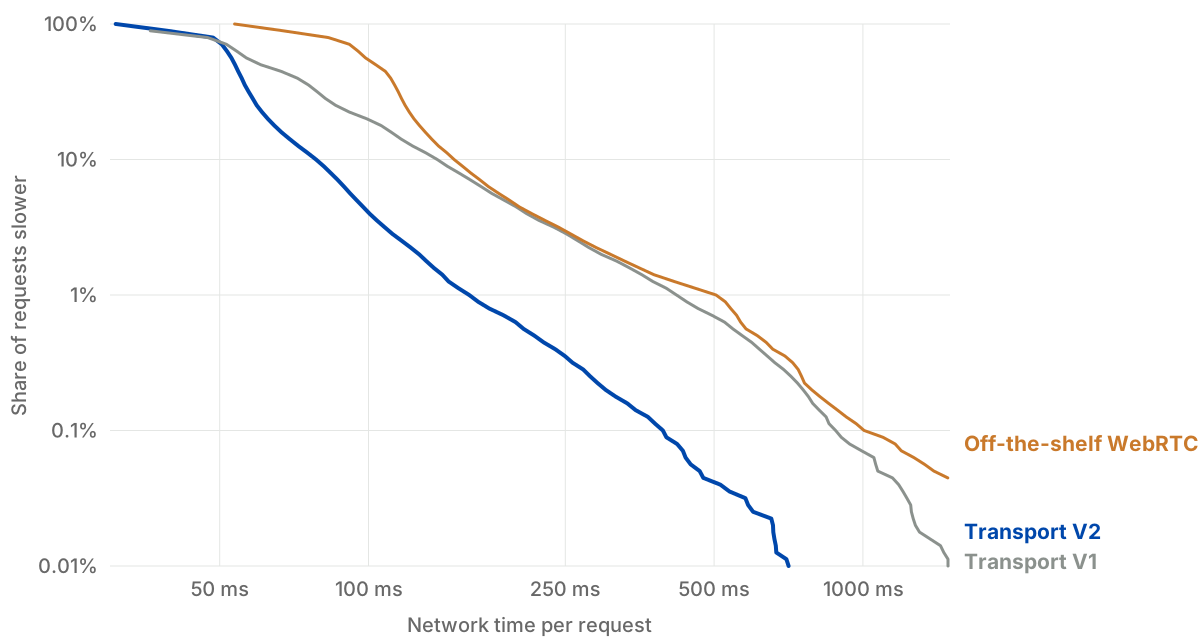
Every transport answered every request. The difference was when the answers arrived. On V1 the robot spent 7.7% of its control steps waiting. On V2 that fell to 1.0%, with less waiting in each of the four hours. The largest latency improvement came at the far end of the distribution. At p99.9, network time fell from 872 ms to 389 ms.
The managed WebRTC service had the longest tail of the three. Its median network time was about twice V2’s (104 ms versus 54 ms), and its p99 was about 3.2 times V2’s (504 ms versus 160 ms). Moving from that service to V2 reduced time waiting by 89%.
What changes over a full day?
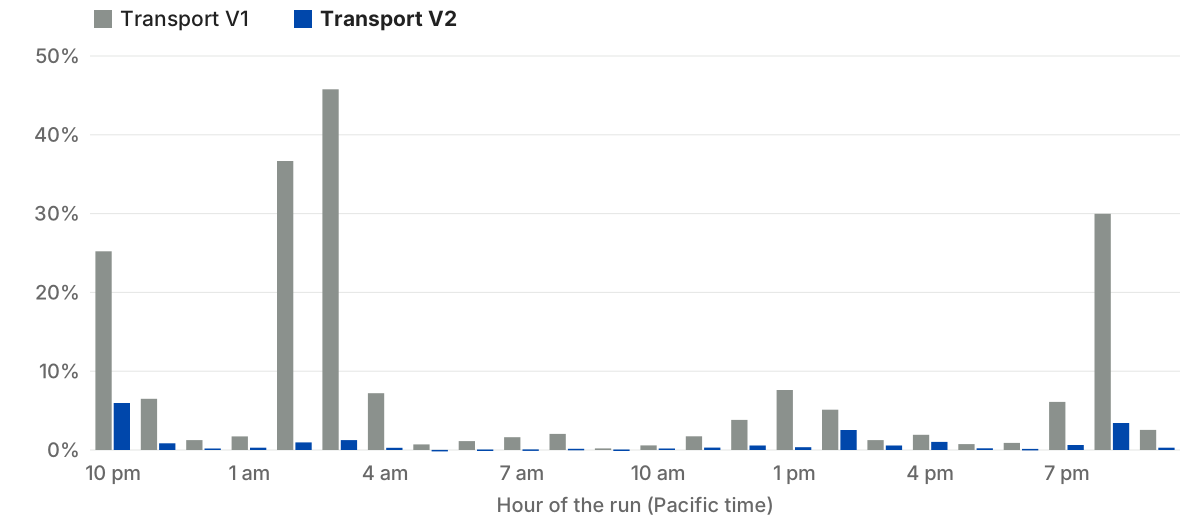
Before the three-way comparison, we ran V1 and a research build of V2 for 24 hours on the same link with the same three-camera workload. V2 spent less time waiting in every hour. Across the day, the share of control steps spent waiting fell from 8.0% to 0.9%. For every 10,000 replies, 685 took longer than 250 ms with V1, compared with 74 with V2.
The gap widened as the link got worse. In V1’s worst hour the robot spent 46% of its time waiting for the next action chunk. On the same link during the same hour, that figure was about 1% for V2.
Where the results apply
These measurements cover one home Wi-Fi network, one internet provider and cloud hosts in US West. We used synthetic frames and simulated model compute throughout. The production build matched the research build in a separate 20-hour run. The comparison with WebRTC covers only the four-hour test on the managed service we used.
Both the link and the observation size affect how much V2 helps. On a quiet wired network, slow round trips are rare and the difference between transports is small. Smaller observations also leave less room for improvement. With two cameras, V2 reduced time waiting by 44%.
Availability
Transport V2 is on for every organization, for every model that connects over QUIC. There is nothing to configure. Update the SDK to get it:
pip install -U dreamscale